Tiles © Esri — Sources: GEBCO, NOAA, CHS, OSU, UNH, CSUMB, National Geographic, DeLorme, NAVTEQ, and Esri.
Tiles © Esri — Esri, DeLorme, NAVTEQ, TomTom, Intermap, iPC, USGS, FAO, NPS, NRCAN, GeoBase, Kadaster NL, Ordnance Survey, Esri Japan, METI, Esri China (Hong Kong), and the GIS User Community.
Tiles © Esri — Source: Esri, i-cubed, USDA, USGS, AEX, GeoEye, Getmapping, Aerogrid, IGN, IGP, UPR-EGP, and the GIS User Community.
This product contains chart data which is licensed by NAVICO and delivered by ChartWorld. Neither NAVICO, ChartWorld nor FUGRO has verified the information in this data and neither accepts liability for its accuracy. Neither NAVICO, ChartWorld nor FUGRO warrants that this product satisfies national or international regulations regarding the use of appropriate products for navigation.
Copyright 1998–Present by Global GIS Data Services, LLC. Mr. Lorin Pruett, President All Rights Reserved Printed in the United States of America
Multilateral AgreementAgreed boundary made by two or more countries.
Unilateral ClaimClaim made by one country.
Equidistant LineThis is a construction of a maritime boundary between two or more opposing nations less than 400 nautical miles apart where one or both nations have yet to make a claim. Or, this may be a limit claim that can be made under UNCLOS but has not been so to date. For Equidistant lines in the GMBD, these are generally calculated using the straight baseline claims of each country.
The Global Law of the Sea Database was compiled by Robert van de Poll, Fugro's Global Director Law of the Sea.
The Global LOS Maritime Boundaries are split into:
200nm EEZ Legal Limits (Global Legal Maritime Limits)
The Regional 200NM Exclusive Economic Zone (EEZ), computed internally from the Fugro LOS database, is based upon the Global TSBM (Territorial Sea Baselines Models) from each and every coastal state of the world.
Global Maritime Boundaries
TreatyFully International Legal Binding Bilateral Treaty agreement in place (Fugro has all supporting documents in its LOS Global Database).
Hypothetical
The LOS Fugro database contains a Global Archive of all Coastal States' Territorial Sea Baseline Models (TSBM, Normal and Straight), supported by LOS documentation and/or created through advanced LOS analysis (using nautical charts and precision satellite imagery). These are then used to create the Hypothetical Fugro Calculated Maritime Boundaries applying geodetic mathematical calculation principles (using Strict Equidistance Line). This offers the same neutral results as used by International Courts and Tribunals for dispute resolutions.
- UnilateralThese Maritime Boundaries are based on a single Coastal State's opinion (Unilateral) of what they feel is their Maritime Boundary. These are not bilaterally agreed upon boundaries (i.e., not legal) as most often they differ dramatically for what their neighbouring and/or opposing coastal states claim.
- OthersThese Maritime Boundaries all contain advanced Intelligence created from advanced Fugro LOS studies, where proprietary relevant information has been acquired and cannot be classified as either Fugro Calculated or Unilateral.
Fugro Global Law of the Sea Active Contentious Layers
Fugro globally monitors all unresolved Maritime Frontiers and is often alerted to contentious issues on some regional frontiers, well in advance of most public sources of media. Thus, it allows Fugro, when working on "Risk aversion LOS studies", to offer a service of Intelligence when marine surveys are being considered that could face unforeseen risks due to Political Maritime Boundary disputes between countries. This advanced Law of the Sea Intelligence reduces a client's risk in the undertaking of their marine operations.
Flanders Marine Institute (2023). Maritime Boundaries Geodatabase: Territorial Seas (12NM), version 4. Available online at https://www.marineregions.org/. https://doi.org/10.14284/633
Contiguous ZonesFlanders Marine Institute (2023). Maritime Boundaries Geodatabase: Contiguous Zones (24NM), version 4. Available online at https://www.marineregions.org/. https://doi.org/10.14284/630
Exclusive Economic ZonesFlanders Marine Institute (2023). Maritime Boundaries Geodatabase: Maritime Boundaries and Exclusive Economic Zones (200NM), version 12. Available online at https://www.marineregions.org/. https://doi.org/10.14284/632
Maxar Products. [Maxar Worldview-2] © [2021] Maxar Technologies
Fetterer, F., K. Knowles, W. N. Meier, M. Savoie, and A. K. Windnagel. Sea Ice Index, Version 3. 2017, Distributed by National Snow and Ice Data Center. https://doi.org/10.7265/N5K072F8. Date Accessed 28-03-2023.
Data InformationThe Ice Coverage Layer is showing by default the mean ice concentration of the last four years for the northern hemisphere. In the dropdown menu the ice coverage can be selected and visualizied for each of those single years which were taken into account fo the mean ice concentration.
The scale goes from 0% to 100% where 0% indicates no ice coverage and 100% constant ice coverage.
Area covered: 180°W to 180°E / 90°N to 30.98°N
Spatial Resolution: 25x25km
Temporal resolution: 1 day (binned to monthly resolution)
Please note, that values less than 15% should be ignored as they are not reliable due to its sensing method. Do not use these values for any survey decisions!UK War Risks: Additional Premium Areas, 7 May 2021.
Author: v.jegat@fugro.com
Date: 21 December 2022
Summary
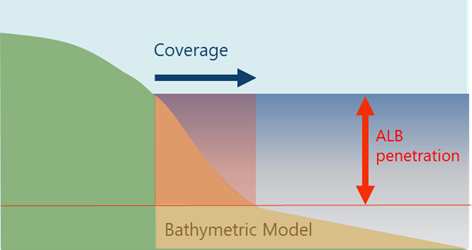
Estimate of Airborne Lidar Bathymetry (ALB) coverage for each month of the year, based on GEBCO 2022 bathymetric model (~450m resolution) and on NOAA Great Lakes bathymetric model (~100 m resolution).
MethodThe estimate is based on the following sources of information:
Author: v.jegat@fugro.com
Date: 28 March 2023
Summary
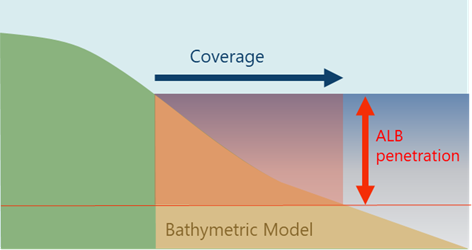
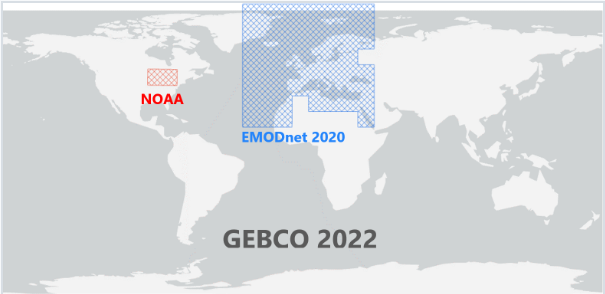
Estimate of Airborne Lidar Bathymetry Shallow water (ALB-S) coverage for each month of the year, based on GEBCO 2022 bathymetric model (~450m resolution) and on NOAA Great Lakes bathymetric model (~100 m resolution) and on EMODnet bathymetry (~115 m resolution).
MethodThe estimate is based on the following sources of information:
Author: v.jegat@fugro.com
Date: 21 December 2022
Summary
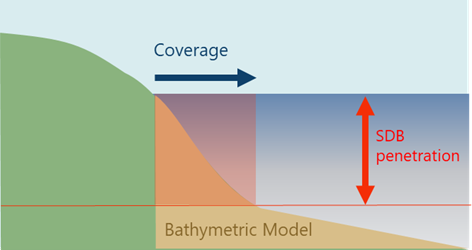
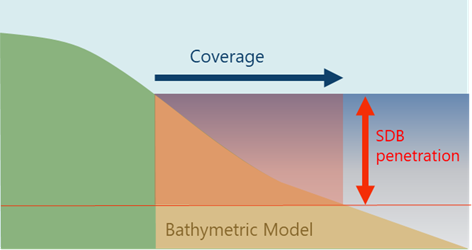
Estimate of Satellite Derived Bathymetry (SDB) coverage for each month of the year, based on GEBCO 2022 bathymetric model (~450m resolution) and on NOAA Great Lakes bathymetric model (~100 m resolution).
MethodThe estimate is based on the following sources of information:
Author: v.jegat@fugro.com
Date: 15 November 2022
Summary
Estimate of water clarity conditions (KD@490nm) for each month of the year, aggregated from OCCCI
product. The unit is in m-1
and at ~4km resolution.
High KD@490nm represents turbid water and lower success for airborne lidar survey or satellite
derived bathymetry.
The estimate is based on the following sources of information:
Author: v.jegat@fugro.com
Date: 15 November 2022
Summary
Estimate of Airborne Lidar Bathymetry (ALB) coverage for each month of the year, based on GEBCO 2022 bathymetric model (~450m resolution)
MethodThe estimate is based on the following sources of information:
Timezone Boundary Builder
Version : 2022g
Timezone Boundary Builder uses data from the Timezone Database (also known as the 'tz database' or 'Olson database') which is maintained by the IANA (Internet Assigned Numbers Authority).
The tz database is a collaborative project with contributions from many individuals and organizations.
More information about the tz database can be found at:
This layer presents the Universal Transverse Mercator (UTM) zones of the world. The layer symbolizes the 6-degree wide zones employed for UTM projection.
The latitude bands were removed from the original dataset.
Sources: Esri; U.S. National Geospatial-Intelligence Agency (NGA)
Shom - ROLNHDF, 2022.
More Information: http://dx.doi.org/10.17183/L3D_MAR_NHDF_2016_2018
Shom - ROLNHDF, 2022.
More Information: Litto3D® - Bretagne 2018-2021
Wells, Pipelines, Rig Locations and Contracts: Version: September 26th, 2023
Source: Enverus
The dataset on Natura 2000 sites was created in 2014 by Cogea for the European Marine Observation and Data Network. It is entirely based on spatial data from the European Environmental Agency (EEA), plus additional info, links and selected EEA data joined to the feature attributes, as well as a calculation by Cogea of marine and coastal location of features. It is available for viewing and download on EMODnet - Human Activities web portal (https://emodnet.ec.europa.eu/en/human-activities). Natura 2000 is an ecological network composed of sites designated under the Birds Directive (Special Protection Areas, SPAs) and the Habitats Directive (Sites of Community Importance, SCIs, and Special Areas of Conservation, SACs). The dataset covers the whole EU. Following the United Kingdom’s withdrawal from the EU on 31 January 2020, it ceased to be part of the EEA’s institutional networks and governance. In the webmap the EEA dataset has been filtered by Cogea to show only (i) marine sites, i.e. sites with a marine area percentage higher than 0 (as calculated by the EEA) and (ii) sites that, even if not identified as marine by the EEA, intersect the EEA coastline or that are within a distance of 1 km from the coastline (using a 1 km inner buffer from the EEA coastline). In both cases the COAST_MAR field value=1. The EEA coastline dataset is available at https://www.eea.europa.eu/data-and-maps/data/eea-coastline-for-analysis-2. Compared with the previous version, this one includes the updated dataset 'Natura 2000 End 2021', published by the EEA in April 2021. For further information (e.g. biogeographic region, directive, habitats, sites, impact, management, species and metadata) please visit the EEA's website hosting the Natura 2000 tabular data.
Unit Nature & Biodiversity, DG Environment, European Commission
The database on offshore wind farms in the EU was created in 2014 by CETMAR for the European Marine Observation and Data Network (EMODnet). It is the result of the aggregation and harmonization of datasets provided by several sources. It is updated every year and is available for viewing and download on EMODnet Human Activities web portal (https://emodnet.ec.europa.eu/en/human-activities). The database contains points and/or (where available) polygons representing offshore wind farms in the following countries: Belgium, Denmark, Estonia, Finland, France, Germany, Greece, Ireland, Italy, Latvia, Lithuania, Netherlands, Norway, Poland, Portugal, Spain, Sweden and United Kingdom. Each point has the following attributes (where available): Name, Nº of turbines, Status (Approved, Planned, Dismantled, Construction, Production, Test site), Country, Year, Power (MW), Distance to coast (metres) and Area (square kilometres). The distance to coast (EEA coastline shapefile) has been calculated using the UTM WGS84 Zone projected coordinate system where data fall in.
EMODnet Human Activities
The Vessel Density maps in the EU are created since the 2019 by Cogea for the European Marine Observation and Data Network (EMODnet). The dataset is updated every year and is available for viewing and download on EMODnet Human Activities web portal (https://emodnet.ec.europa.eu/en/human-activities). The maps are based on AIS data yearly purchased from Collecte Localisation Satellites (CLS) and ORBCOMM. The maps, GeoTIFF format, show shipping density in 1x1km cells of a grid covering all EU waters and some neighbouring areas. Density is expressed as hours per square kilometre per month. The following ship types are available:0 Other, 1 Fishing, 2 Service, 3 Dredging or underwater ops, 4 Sailing, 5 Pleasure Craft, 6 High speed craft, 7 Tug and towing, 8 Passenger, 9 Cargo, 10 Tanker, 11 Military and Law Enforcement, 12 Unknown and All ship types. Data are available by month of year. Yearly averages are also available.
Mean depth rainbow colour (no land)
The "EMODnet Digital Bathymetry (DTM)" is a multilayer bathymetric product for Europe’s sea basins and the Caribbean Seas. The DTM is based upon a collection of bathymetric surveys, Composite DTMs and Satellite Derived Bathymetry bathymetric data . Areas not covered by observations are completed by integrating GEBCO, IBCAO and GMRT data sets.
EUSeaMap 2021 Substrate type group - all simplification levels
Group layer containing EUSeaMap 2021 Substrate type layers with simplification levels of 200m, 400m and 800m and full detail for fast WMS viewing at all scales.
Classified seabed substrate types for European seas. Produced by EMODnet Seabed Habitats as an input layer for the 2021 EUSeaMap broad-scale habitat model, based on a combination of EMODnet Geology seabed substrate products and biological substrates extracted form individual habitat maps from surveys around European seas. The extent of the mapped area includes the Mediterranean Sea, Black Sea, Baltic Sea, and areas of the North Eastern Atlantic extending from the Canary Islands in the south to the Barents Sea in the north. The layer of seabed substrate was produced using data from EMODnet geology at the following scales: - 1:25k, 1:30k, 1:45k, 1:60k, 1:70k (a new fine scale layer as of 2021) - 1:50k 1:100k,1:250k (these were updated for 2021) - 1:1M (not updated for 2021) Biological substrates were included in the 2021 version of EUSeaMap to assist in the classification of biogenic habitats for the 2019 version of EUNIS. The Folk 5 classification of substrate is adopted because it is compatible with both the 2007-11 and 2019 versions of EUNIS, both of which have been applied in EUSeaMap 2021. A report on the methods used in the 2021 version of EUSeaMap (Vasquez et al., 2021) and reports on previous versions (v2016 and V2019) are linked in Online Resources.
Seagrass cover (Essential Ocean Variable) in Europe (v2019)
This layer shows the current known extent of Seagrass meadows in European waters, collated by EMODnet Seabed Habitats. Seagrasses provide essential habitat and nursery areas for many marine fauna. There are approximately 72 seagrass species that belong to four major groups: Zosteraceae, Hydrocharitaceae, Posidoniaceae and Cymodoceaceae. Zostera beds and Cymodecea meadows are named on the OSPAR Threatened or Declining Habitats list. Posidonia beds are protected under Annex I of the EU Habitats Directive. This data product should be considered a work in progress and is not an official product.
EMODnet Seabed Habitats
Group layer containing EUSeaMap 2021 classified to the EUNIS 2007 Classification system with simplification levels of 200m, 400m and 800m simplification for fast WMS viewing at all scales.
Output of the 2021 EUSeaMap broad-scale predictive model, produced by EMODnet Seabed Habitats.
The extent of the mapped area includes the Mediterranean Sea, Black Sea, Baltic Sea, and areas of the North Eastern Atlantic extending from the Canary Islands in the south to the Barents Sea in the north.
The map was produced using a "top-down" modelling approach using classified habitat descriptors to determine a final output habitat.
Habitat descriptors differ per region but include: Biological zone, Energy class, Oxygen regime, Salinity regime, Seabed substrate, Riverine input
Habitat descriptors (excepting Substrate) are calculated using underlying physical data and thresholds derived from statistical analyses or expert judgement on known conditions.
The model is produced using R and Arc Model Builder (10.1).
The model was created using raster input layers with a cell size of 0.00104dd (roughly 100 metres). The model includes the sublittoral zone only; due to the high variability of the littoral zone, a lack of detailed substrate data and the resolution of the model, it is difficult to predict littoral habitats at this scale.
EUSeaMap is classified into EUNIS 2019 level 3 (or more detailed levels where appropriate), EUNIS 2019 level 2 , EUNIS 2007-2011, the MSFD benthic broad habitat types, the HELCOM HUB classification in the Baltic, and the recently revised habitat classification in the Mediterranean. In the Black Sea, EUSeaMap is not classified into EUNIS 2007-2011 (due to inapplicability), but is classified according to a classification that was developed by EMODnet Seabed Habitats (Populus et a, 2017, and for a revised version Vasquez et al, 2020, See Online resources).
Reports that provide methods used for the classification of the predicted habitats into the new 2019 EUNIS classification, regional classifications, and MSFD BBHT (v.2017) are linked in Online Resources.
A report on the methods used in the 2021 version of EUSeaMap (Vasquez et al., 2021) and reports on previous versions (v2016 and V2019) are linked in Online Resources.
EMODnet Seabed Habitats
Group layer containing EUSeaMap 2021 classified to the EUNIS 2019 Classification system with simplification levels of 200m, 400m and 800m simplification for fast WMS viewing at all scales.
Output of the 2021 EUSeaMap broad-scale predictive model, produced by EMODnet Seabed Habitats.
The extent of the mapped area includes the Mediterranean Sea, Black Sea, Baltic Sea, and areas of the North Eastern Atlantic extending from the Canary Islands in the south to the Barents Sea in the north.
The map was produced using a "top-down" modelling approach using classified habitat descriptors to determine a final output habitat.
Habitat descriptors differ per region but include: Biological zone, Energy class, Oxygen regime, Salinity regime, Seabed substrate, Riverine input
Habitat descriptors (excepting Substrate) are calculated using underlying physical data and thresholds derived from statistical analyses or expert judgement on known conditions.
The model is produced using R and Arc Model Builder (10.1).
The model was created using raster input layers with a cell size of 0.00104dd (roughly 100 metres). The model includes the sublittoral zone only; due to the high variability of the littoral zone, a lack of detailed substrate data and the resolution of the model, it is difficult to predict littoral habitats at this scale.
EUSeaMap is classified into EUNIS 2019 level 3 (or more detailed levels where appropriate), EUNIS 2019 level 2 , EUNIS 2007-2011, the MSFD benthic broad habitat types, the HELCOM HUB classification in the Baltic, and the recently revised habitat classification in the Mediterranean. In the Black Sea, EUSeaMap is not classified into EUNIS 2007-2011 (due to inapplicability), but is classified according to a classification that was developed by EMODnet Seabed Habitats (Populus et a, 2017, and for a revised version Vasquez et al, 2020, See Online resources).
Reports that provide methods used for the classification of the predicted habitats into the new 2019 EUNIS classification, regional classifications, and MSFD BBHT (v.2017) are linked in Online Resources.
A report on the methods used in the 2021 version of EUSeaMap (Vasquez et al., 2021) and reports on previous versions (v2016 and V2019) are linked in Online Resources.
EMODnet Seabed Habitats
Last update on dataset: 14.06.2023
Last update on dataset: 30.03.2023
Product Description - The Bathymetric Surface Data Product consists of a set of grided value matrix values organized to form a quadrilateral grid coverage with associated metadata representing a bathymetric depth model for an area of the sea, river, lake or other navigable water.
The data includes depth estimate values and uncertainty estimates associated with the depth values. Additionally a discrete point set called a "tracking list" allows a hydrographer to override any particular grid matrix value to deliberately bias the data for safety of navigation. The data set can carry both measured depth information for scientific purposes as well as corrected depth information used for navigation.
To access the Licensing terms for the use of this data please click here.